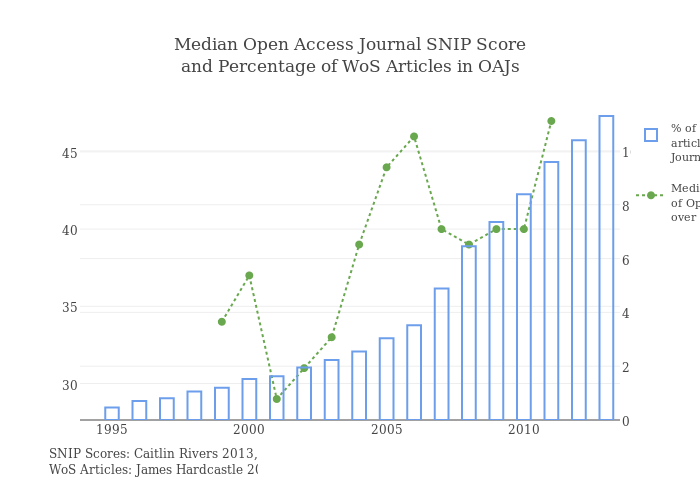
If you’ve ever crunched numbers in Excel spreadsheets or Google and plotted them in a PPT, you’ll know the pain of wanting to edit or maybe share that data, but not having the extensive and original data to refer to.
That’s the problem I have with today’s current solutions to interact with data and put into reports.
Plot.ly hopes to solve that, and much more. (Click on the above graph and you’ll go to a page where you can see all the data inputed into an Excel spreadsheet combined with code also used to plot the same graph.)
The new business intelligence startup, which is based in San Francisco, just raised $5.5 million in a Seed round of financing, just a couple years after starting in August 2013. The round was led by MHS Capital, Siemens Venture Capital, Rho Ventures, Montreal-based Real Ventures, and Silicon Valley Bank.
Plot.ly essentially allows users – data scientists, journalists, researchers, coders – to take data from spreadsheets or script files and plot it in a graph. But it also allows those same users to share that graph and enable others to see the data that went into creating that graph.
Here’s an example from one of their customers, Joe Gibbs Racing, which is a group of NASCAR racing teams owned by Joe Gibbs, the former Washington Redskins coach. “The Web app that we wrote that uses plotly replaces an existing MATLAB script that produced a PDF report. The users are now able to interact with the plots, and change the datae being plotted on the fly.”
The tradition problem is that if someone has an Excel spreadsheet and wants to collaborate with someone else, they take that spreadsheet and email it to someone else, who then can manipulate the data. Then if that data is plotted into a graph and put into a Power Point Presentation or PDF to be embedded or put into a report, the underlying data is gone. With Plot.ly, the data is accessible because the graph is interactive, explained Matt Sundquist, co-founder and COO, in an interview.
“What Plotly does is take your figures from programming language and Excel and makes it interactive and shares it with an embedded URL,” said Sundquist.
At the moment, there are 200,000 users of Plot.ly and a dozen enterprise clients. Sundquist wouldn’t disclose the pricing model, only to say that companies pay per seat for an enterprise solution, meaning the data stays within a company’s firewall and servers.
You can see some examples of Plot.ly’s embeddable graphs here.


